You can now use a tuner from the metronome screen. It listens to your instrument through the microphone and shows the nearest note and octave, the offset in cents, and the frequency. A cent is a unit of pitch, one hundredth of a semitone. A drone, which keeps playing the note you pick, arrived at the same time. I wrote about the drone in another article.
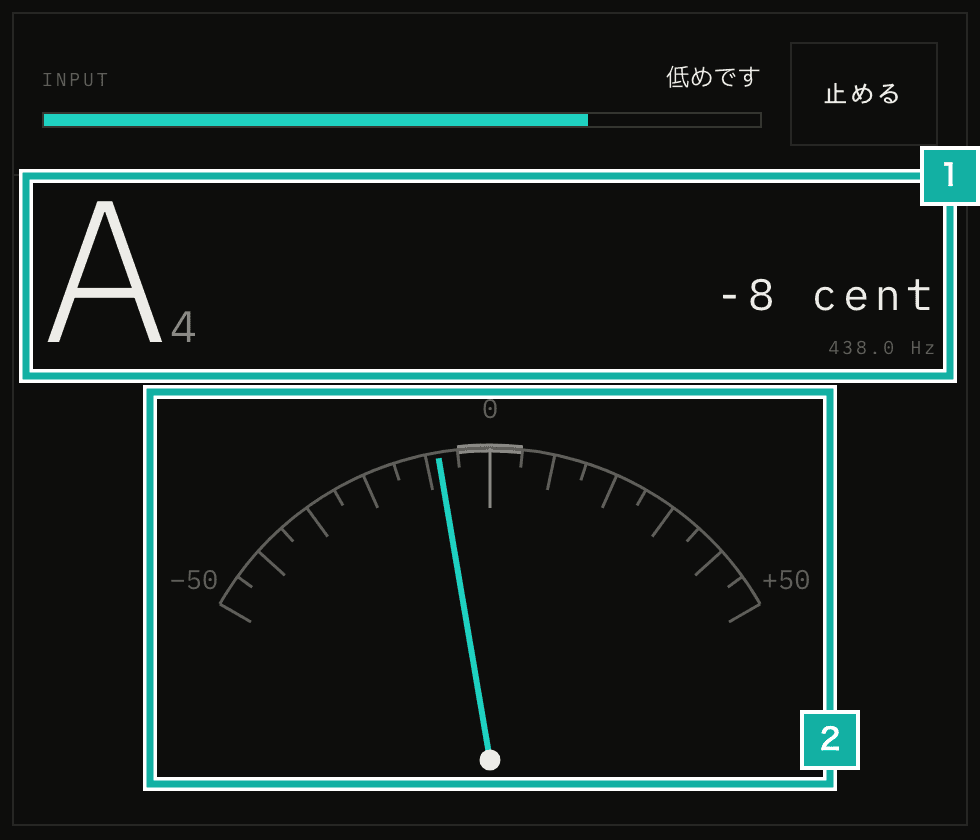
- The nearest note and octave, the offset in cents, and the frequency
- The arc meter. Left is flat, right is sharp
This article covers how the tuner works inside: how it finds the pitch of the microphone input, what I fixed to get the measurement error under one cent, and how the needle moves smoothly with the measured values.
Finding the pitch of the microphone input
The microphone input goes into an AnalyserNode. The sound arrives as a series of samples, each one the height of the wave measured at a fixed interval. At 48 kHz, there are 48,000 samples per second. Every 60 ms the tuner takes the latest 4096 samples (about 85 ms at 48 kHz) and analyzes them.
To find the pitch I used the McLeod method. It shifts the signal little by little, overlays it on the original, and gives each shift a score from -1 to 1 for how similar the two are (this is called a normalized autocorrelation). The score peaks when the shift is exactly one period, so the position of that peak gives the period and the frequency. The tuner finds the peak position more finely than one sample by fitting a parabola through the peak and its two neighbors.
Peaks appear not only at one period but also at two and three periods. On instruments with strong overtones, the peak at two periods can even be the highest. Picking the highest peak would then read the note one octave low. So, among the peaks that reach 90% of the height of the highest one, the tuner picks the first.
const highest = Math.max(...peaks.map((tau) => nsdf[tau]));
const chosen = peaks.find((tau) => nsdf[tau] >= highest * PEAK_THRESHOLD); // 0.9Separately, if the score of the chosen peak itself is below 0.8, the sound is treated as having no clear period (noise or percussion), and no pitch is shown.
The low E of a bass wasn't detected
In tests with generated tones, only E1 on a 4-string bass (about 41 Hz) wasn't detected.
The tuner looked for peaks in the stretch between where the similarity score crosses zero going up and where it crosses zero going down. At 48 kHz, one period of E1 is about 1165 samples. The range of shifts it searched, on the other hand, ended at about 1265 samples, set by the lowest frequency it looks for (38 Hz). The score started falling after the peak, but the range ended before it crossed zero, so the peak was never counted.
So now a peak counts even if the score hasn't crossed zero going down by the end of the range. It doesn't count, though, when the highest value is at the very end of the range. If it isn't at the end, the score has already started to fall.
// Low notes run out of range before the score falls back through zero after the peak.
// If it has started to fall (the peak is not at the end), count it as a peak
if (state.inside && state.best >= minLag && state.best < nsdf.length - 1) {
  peaks.push(state.best);
}Higher notes drifted
After fixing the low E, I generated sawtooth waves, which are rich in overtones (close to the sound of string and wind instruments), and measured the error of the detected pitch in cents. The 44.1 kHz and 48 kHz columns are the number of samples per second of the generated sound.
Frequency | 44.1 kHz | 48 kHz |
|---|---|---|
82.41 Hz | +0.15 | -0.56 |
110 Hz | -0.50 | -0.14 |
220 Hz | -0.39 | +0.32 |
440 Hz | +1.07 | +0.49 |
880 Hz | +1.54 | -1.33 |
The error was large for the high notes at 440 Hz and 880 Hz, and at 880 Hz it was off by nearly 1.5 cents.
The tuner finds the peak position more finely than one sample with a parabola. But at 48 kHz one period of 880 Hz is only about 55 samples, so the error from estimating between samples with the parabola is a large share of the period.
So if there is a peak of similar height a few periods further on, the tuner divides that shift by the number of periods. Using the peak ten periods away, for example, cuts the estimation error to a tenth. The period is still decided by the first peak chosen in the previous section. A later peak is used only to get a finer value, and only if it sits close to a whole multiple of that period.
const multiple = peaks
  .map((tau) => ({ tau, count: Math.round(tau / first.lag) }))
  .filter(
    ({ tau, count }) =>
      count >= 2 &&
      Math.abs(tau - count * first.lag) <= 2 &&
      nsdf[tau] >= first.value * PEAK_THRESHOLD,
  )
  .at(-1);
const lag = multiple
  ? refineLag(nsdf, multiple.tau).lag / multiple.count
: first.lag;Separately from accuracy, I also made the analysis faster (before, each analysis took 4.2 to 4.8 ms). Audio at 44.1 kHz or 48 kHz is now halved by averaging each pair of neighboring samples before analysis. The tuner only looks for pitches up to 2000 Hz, and even at half the rate there are more than ten times that many samples per second (22.05 kHz or 24 kHz). Both the shifts and the samples are halved, so the work drops to about a quarter.
Here are the results measured the same way after both changes.
Frequency | 44.1 kHz | 48 kHz |
|---|---|---|
82.41 Hz | +0.19 | -0.28 |
110 Hz | -0.56 | +0.03 |
220 Hz | -0.07 | +0.02 |
440 Hz | +0.12 | -0.03 |
880 Hz | +0.16 | +0.16 |
The largest error is now 0.56 cents, and each analysis takes 1.1 to 1.4 ms. Automated tests now check that the error on sawtooth waves stays under one cent.
Moving the needle smoothly
The measured value only changes every 60 ms, and it wobbles a little each time. At first, to hold down the wobble, the tuner showed the median of the last five values.
I fed a fake microphone tone into the browser, changed its pitch, and recorded the needle angle every time the screen was redrawn (every frame). The needle took about 0.23 seconds to start moving after the sound changed. That is because the median does not change until three of the five values come from the new note. Once it started moving, the needle jumped every time a new value arrived.
So the median now covers only the last three values, just to drop the occasional outlier. The finer wobble is now smoothed by how the needle moves. The needle moves toward the target value like a critically damped spring (one that settles fastest without overshooting). It almost catches up about 0.3 seconds after the target value changes. The 0.23 seconds above is the time until the needle starts moving, so the two numbers measure different things.
export const stepNeedle = (state, target, elapsed, stiffness = 14) => {
  const offset = state.value - target;
  const carry = (state.velocity + stiffness * offset) * elapsed;
  const decay = Math.exp(-stiffness * elapsed);
  return {
    value: target + (offset + carry) * decay,
    velocity: (state.velocity - stiffness * carry) * decay,
  };
};The spring uses its exact solution rather than an approximation that adds up small steps. So the needle reaches the same position at the same time even when the interval between frames varies.
Each frame, the position is written straight to the element with requestAnimationFrame instead of going through a React re-render. When reduced motion is turned on in the OS, the needle skips the spring and appears at the target position right away.
For the look of the meter, you can choose a straight scale besides the arc. Both have a tick every 5 cents and mark the ±5 cent range in the center. When the needle is inside that range, the tuner says "In tune".
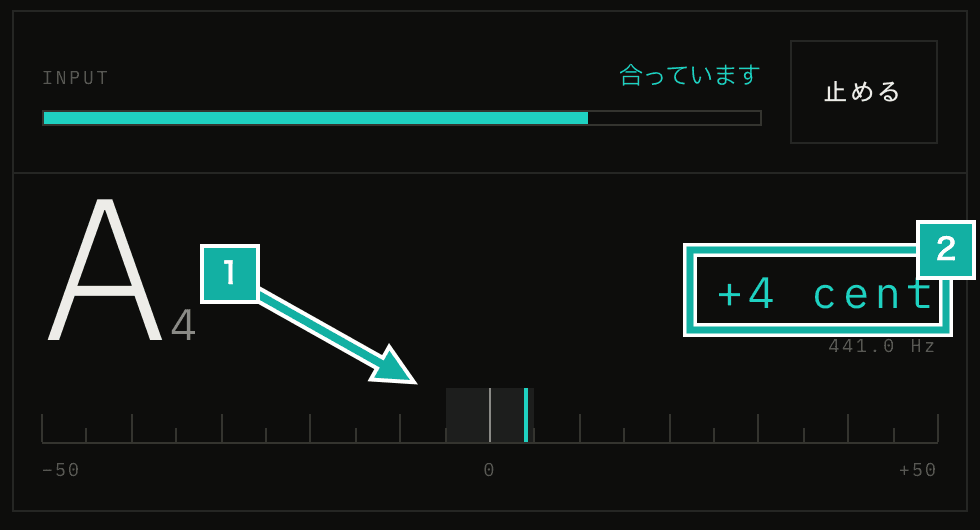
- The ±5 cent range in the center. The needle is inside it
- Inside the range, the offset and "In tune" appear in the accent color