In the previous post, we raised our landing page's mobile PageSpeed Insights score from 31 to 61–69 without changing its animations. Even so, the mobile LCP (the time until the largest element on the first screen is painted) was still 4.4–5.9 seconds, short of Google's "good" threshold of 2.5 seconds.
This time we looked at what the whole site loaded, not just the landing page. Running Lighthouse, the tool behind PageSpeed Insights, locally (mobile, median), the Japanese landing page (/ja) went from 62 to 69 and the English one (/en) from 56 to 69. As before, the scroll-driven animations look and move the same.
Lighthouse estimates LCP from everything that starts loading before the real LCP
As we found last time, the element that counts for LCP on the landing page is the "Open the app" button in the header. When we throttled the network and CPU locally, the button was painted at the same moment as the first paint (FCP). Even so, Lighthouse reported an LCP more than 3 seconds later than FCP.
Lighthouse loads the page without throttling, then calculates what the timings would be on a slow connection from that recording (simulated throttling). For LCP, it takes every request that started before LCP in the unthrottled load, and calculates how long loading all of them would take over the slow connection. Without throttling, the landing page reached LCP in about 0.15 seconds, and by then 42 requests totaling about 960KB had already started. JS and images that the first screen does not need all count toward the LCP estimate.
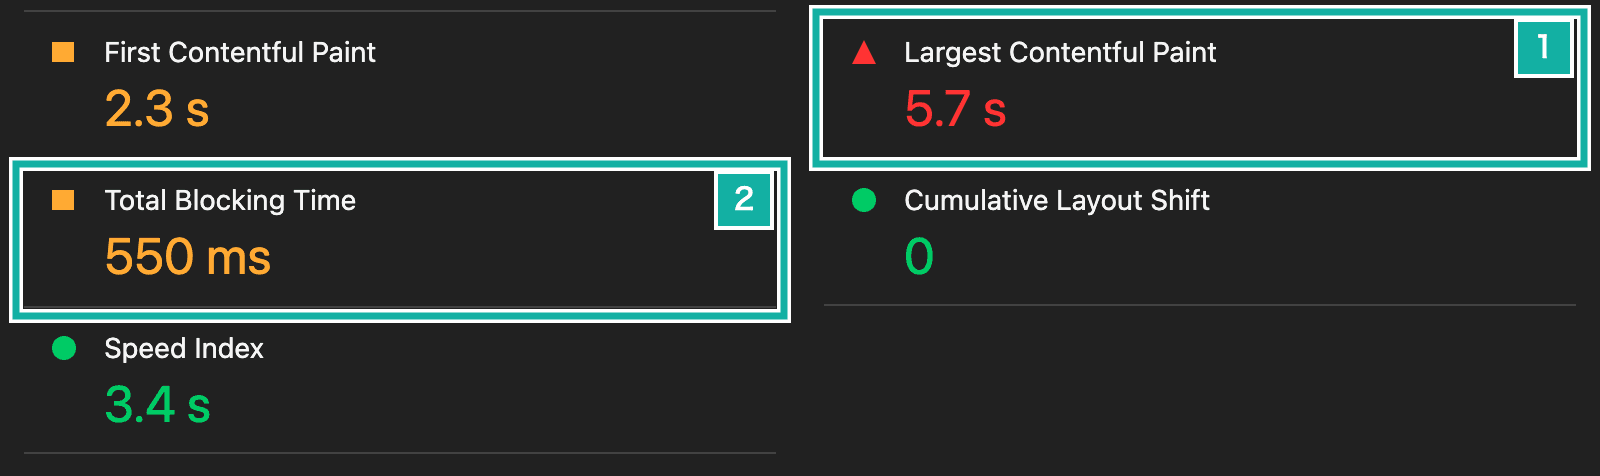
- LCP is 5.7 s, more than 3 seconds later than FCP (2.3 s)
- TBT (the total time long tasks kept the page from responding to input) is 550 ms
So we set out to load less before the first screen is painted. We cut three things: the render-blocking CSS, the JS loaded up front, and the images not visible on the first screen. After that, we also worked on a long task left over after loading.
The 100KB of render-blocking CSS was font definitions
Lighthouse's "Render-blocking requests" (the list of requests that block rendering) listed four CSS files that blocked rendering on the landing page. One was 100KB, and the rest were 20KB or less.
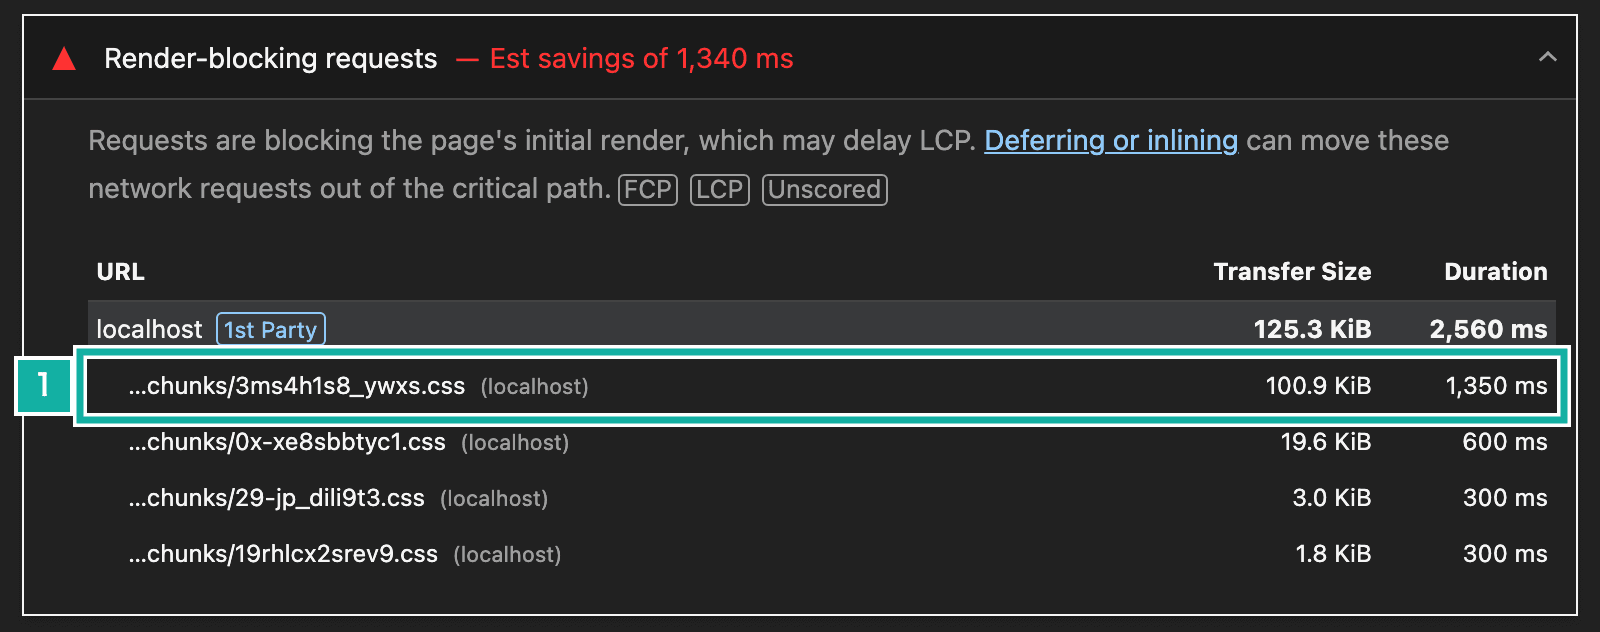
- The 100KB CSS file. It held 370 @font-face rules for IBM Plex Sans JP
That CSS held 370 @font-face rules, about 280KB uncompressed. They came from loading IBM Plex Sans JP with next/font/google in the root layout, the outer frame shared by every page.
On Google Fonts, IBM Plex Sans JP is split into about 120 files by character range (unicode-range), so three weights add up to about 360 @font-face rules. Even with only latin in subsets, next/font still puts the definitions for the Japanese ranges in the CSS. It bundles that CSS into the CSS of the layout or page that loads the font. Because we loaded it in the root layout, it ended up in the render-blocking CSS of every page.
Last time, we started drawing the landing page's Japanese text with a small font (a subset) that contains only the characters the page uses. That cut down the font files we loaded, but the 370 definitions for the full IBM Plex Sans JP used by the app and elsewhere were still there. The landing page does not need them.
So now only the layouts other than the landing page (the app, the docs and the blog) load IBM Plex Sans JP. The CSS variable that points to the font is also used by elements rendered directly under <body>, such as modals. A variable defined on a layout element doesn't reach elements outside it, so we define it on :root.
import { ibmPlexSansJp } from "@/app/_styles/mfm/sans-jp-font";

export const SansJpFontVariable = () => (
  <style>{`:root{--font-ibm-plex-sans-jp:${ibmPlexSansJp.style.fontFamily};}`}</style>
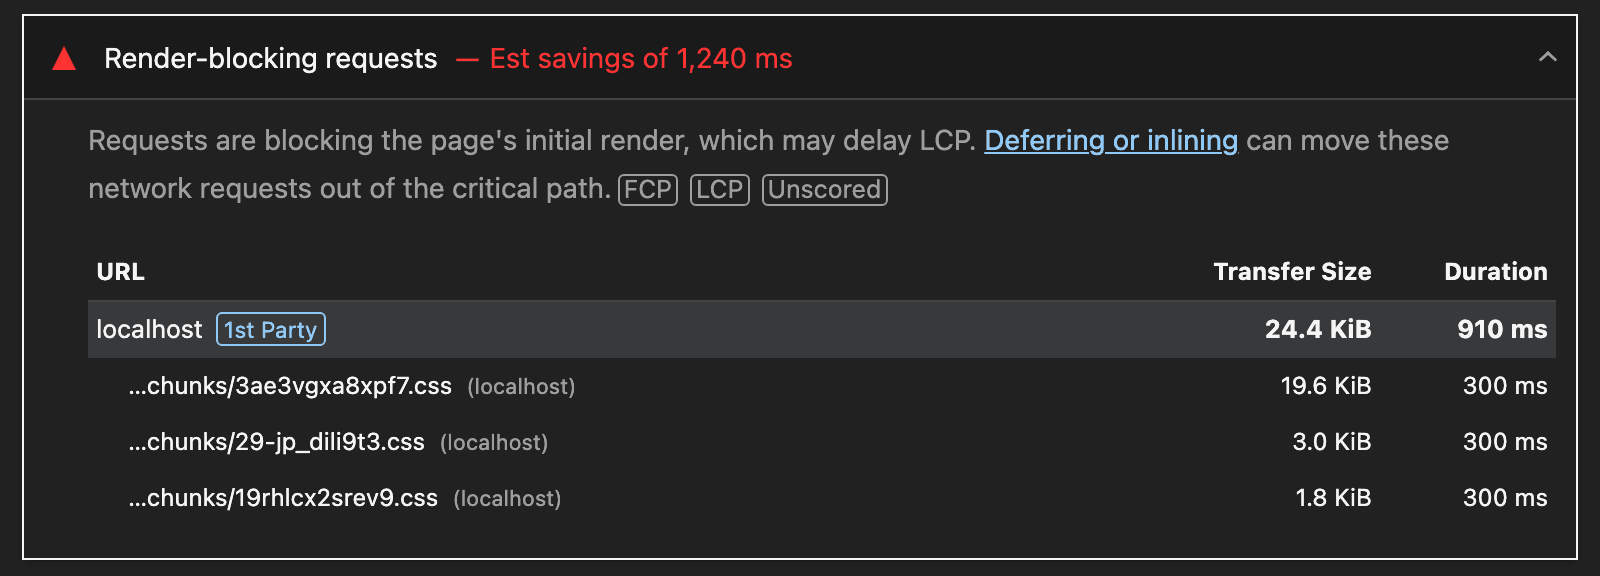
);The render-blocking CSS on the landing page went from 125KB to 25KB in total across those files. Characters missing from the landing page's subset used to be drawn with the full IBM Plex Sans JP; now they are drawn with a system font such as Hiragino Sans. We rebuild the subset whenever the landing page's copy changes, so missing characters normally don't appear.
zod was attached to every page
Next, we took the JS the landing page loads up front and counted it by original source file using source maps (the same method as last time). The biggest chunk was zod, about 240KB uncompressed. zod is a library that checks whether data has the right shape, but nothing on the landing page uses it.
Following the chain of imports led to instrumentation-client.ts, the file Next.js runs in the browser before the app's code.
import { z } from "zod";

// Our CSP does not allow eval, so turn off zod's JIT
z.config({ jitless: true });When zod v4 defines a schema, it tries Function("") to check whether eval is available. If it is, zod uses eval to generate faster validation code (JIT). Our CSP (the security setting that controls what a page may run) does not allow eval, so this check in the browser kept arriving as CSP violation reports. The setting above turns off the JIT so the check stops. It writes to a variable inside zod, so there is no way to set it without loading zod, and as a result every page carried all of zod. We also tried importing only config from zod/v4/core, but core alone is about 200KB, so that barely helped.
Instead, zod is now imported from lib/zod.ts, and the JIT setting lives there too. On pages that use zod, the setting takes effect before any schema is defined. Pages that don't use zod don't load it. The violation reports only come from the browser, so the JIT is turned off only in the browser.
import { z } from "zod";

if (typeof window !== "undefined") {
  z.config({ jitless: true });
}

export { z };Importing "zod" directly would let code define schemas without going through this setting. So ESLint's no-restricted-imports reports an error when any file other than lib/zod.ts imports "zod" directly.
zod also came in through one more path. The code that exports metronome settings as a JSON file is loaded on every page. It imported the settings file's version number and value limits from the same file as the zod schema. We moved the version number and value limits into a separate file that doesn't use zod.
With zod gone and similar changes, the JS the landing page loads up front went from about 1,700KB to about 1,440KB uncompressed.
Loading images not visible on the first screen later
The landing page has a section that shows a screen recording of the app. We added loading="lazy" to that video's poster image (the image shown before it plays, about 75KB). The image is below the first screen, yet it was loaded as soon as the page opened. Its size is fixed by its frame, so nothing moves when it loads.
We dropped the idea of deferring the demos' JS
In the middle of the landing page is a strip of cards that slide sideways to introduce the app's features. There are seven cards, and each holds a demo made from the same components as the app. They all sit below the first screen, so we also tried fetching the demos' JS (about 400KB) only after the page had finished loading.
The server still rendered the demos' HTML as before, and in the browser React.lazy and Suspense held off hydration until the JS arrived. In local Lighthouse runs this cut about another 0.7 seconds from LCP, but we backed it out.
When we checked with a throttled connection, the demos briefly disappeared and were rebuilt whenever hydration finished before the page did. When an update reaches the inside of a Suspense boundary that hasn't hydrated yet, React throws away the HTML the server rendered and renders it again on the client. We think some value in a component wrapping the demos changed while the demos' JS was still on its way, but we haven't pinned down which one.
The demos are usually off screen, so most people wouldn't notice them disappearing. Still, it breaks our rule of not changing how the animations look, so we left it out this time. We found it when an E2E test (an automated test that drives a browser) that presses a demo's START button to check the sound failed because the button it pressed had been detached from the DOM.
Setting up the scroll animations one section at a time
A long task of about 0.3 seconds also remained right after hydration. The profile showed the landing page's sections creating their ScrollTrigger pins (which hold a section in place on screen while you scroll). ScrollTrigger measures layout each time one is created, so the React effects that run after hydration were measuring once per section.
The opening animation that plays when the page opens and the first section (the hero) are still created right away. The sections below them are now created one at a time, each in its own task.
A pin adds spacing to the page for the scrolling it holds the section through. If a lower section is created first, it sets its position without knowing about spacing added later above it, and ends up off. So we create them from the top section down. React calls sibling effects in order, so we queue them in that order and run them one by one with setTimeout.
export const useGSAPInOwnTask = (
  callback: () => void | (() => void),
  config: Parameters<typeof useGSAP>[1],
) =>
  useGSAP(
    (context: gsap.Context) =>
      runInOwnTask(() => {
        context.add(callback);
      }),
    config,
);The animations are added to useGSAP's context, so they are reverted when a section unmounts. In each section, the only change is replacing useGSAP( with useGSAPInOwnTask(.
We also changed the ScrollTrigger re-measure (ScrollTrigger.refresh()) at the end of the opening, which the previous post left as an open issue. Scrolling is locked during the opening, and the scrollbar disappears while it is locked. When scrolling is unlocked, the scrollbar comes back and the page width changes, so we re-measured everything. On phones, the scrollbar overlays the content and takes no space, so the width doesn't change. Now we re-measure only when the width changes.
const widthWhileLocked = document.documentElement.clientWidth;
applyToPage(false);
state.lenis?.resize();
if (document.documentElement.clientWidth !== widthWhileLocked) {
  ScrollTrigger.refresh();
}We tripped up here once. At first, we also skipped the smooth scrolling library's (Lenis) re-measure (lenis.resize()) when the width didn't change, and wheel scrolling stopped working. Because the pins for the lower sections are now created later, the page gets longer after Lenis is created. Lenis re-measures when the size of <html> changes. On this site, the page content sits inside a container sized to the screen, so <html> stays the height of the screen. As a result, Lenis never notices the page getting longer. The lenis.resize() at the end of the opening was covering for that.
We were comparing screenshots to check the look (see the next paragraph), but that didn't catch this, because we scrolled with window.scrollTo, which doesn't go through Lenis. We noticed when the landing page's E2E tests that scroll with the wheel failed. Now Lenis always re-measures, and only ScrollTrigger waits for a width change.
As last time, we checked with screenshots that the animations look the same. We picked 17 scroll positions, captured the landing page before and after at phone and desktop widths, and compared them pixel by pixel. The scrollable length matched exactly. The only differences were the angle of the hero's pendulum and the playhead line, both of which keep moving over time, so the screenshots caught them at slightly different moments.
Results
These are medians of five local Lighthouse runs (mobile) against a production build made locally, before and after. We ran them alternately on the same machine, but Lighthouse results vary from run to run.
Page | Score | LCP | TBT |
|---|---|---|---|
/ja | 62 → 69 | 5.7 s → 4.8 s | 557 ms → 404 ms |
/en | 56 → 69 | 6.4 s → 5.3 s | 623 ms → 394 ms |
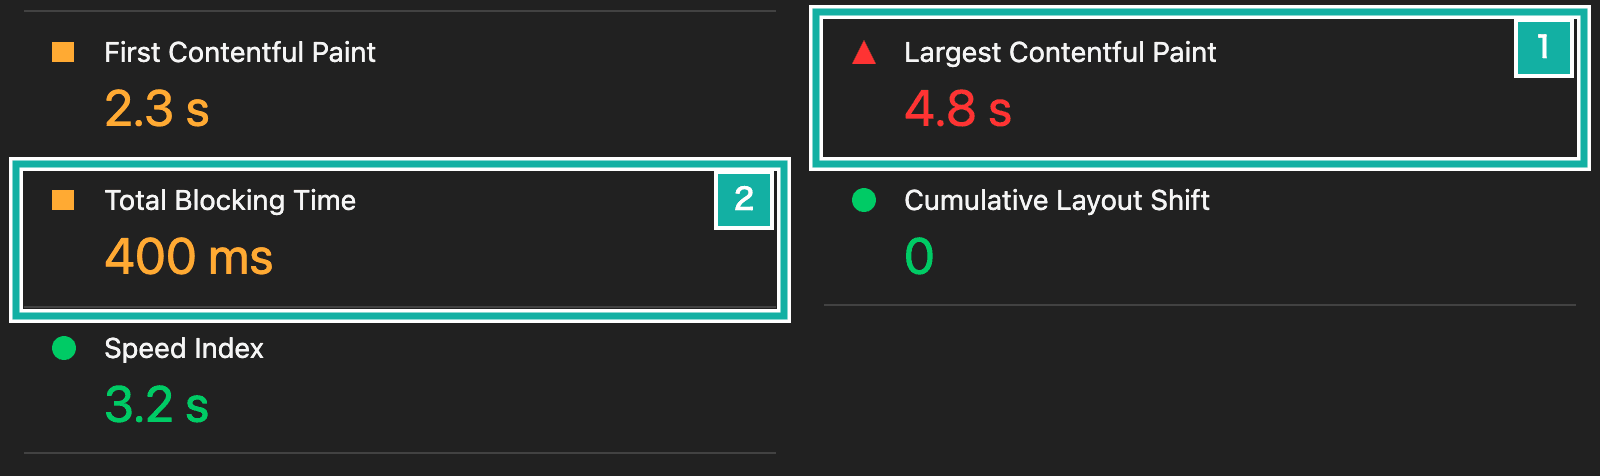
- LCP is 4.8 s
- TBT is 400 ms
The next table is not Lighthouse's estimate. As in the previous post, these values were measured in the browser with the CPU actually slowed down 4x and the network throttled to 1.6Mbps (average of three runs; TBT is an estimate from the Long Tasks API). As noted in the first section, with this method the button is painted together with the first paint, so FCP and LCP share one row.
Item | Before | After |
|---|---|---|
FCP and LCP | about 2.9 s | about 0.9 s |
TBT | about 0.53 s | about 0.41 s |
Longest task | about 0.34 s | about 0.27 s |
JS loaded up front (uncompressed) | about 1,700KB | about 1,440KB |
Render-blocking CSS (transferred) | about 125KB | about 25KB |
The LCP estimate still hasn't reached the "good" 2.5 seconds. What remains is the time to load Next.js and React (about 490KB uncompressed), GSAP for the opening animation (about 120KB), the landing page's subset fonts (about 110KB) and the demos' JS over a slow connection. The first three can't go if we keep the animations. For the demos' JS, we'll try deferring it again once we've found what triggers the rebuild.