We measured the Metronome.fm landing page with PageSpeed Insights and got a mobile performance score of 31. The app and documentation pages scored 70 to 78, so the landing page was far behind.
The landing page has a lot of scroll animations built with GSAP. We wanted to see how far we could raise the score without changing how those animations look or move. On production PageSpeed Insights (mobile), the Japanese landing page (/ja) went from 31 to 61–69 and the English one (/en) from 40 to 61–69.
This post covers how we found the causes and the four places we fixed: the setup work done before animations run, the header, Clerk, and the Japanese font.
Measuring locally and narrowing the cause down to a function
PageSpeed Insights reported a TBT (time the main thread was blocked) of 2.6 seconds. The app page is around 0.3 seconds, so something on the landing page was running for a long time right after load.
PageSpeed Insights only points to a position inside a minified chunk. It doesn't tell you which component the work belongs to. So we built a production build locally with source maps, mapped a CPU profile back to the original code, and counted how much time each function took.
- Temporarily add
productionBrowserSourceMaps: truetonext.config.tsand build - Open the landing page with Playwright and, through the Chrome DevTools Protocol, slow the CPU down 4x and limit the network to 1.6 Mbps down (close to PageSpeed Insights' mobile setup)
- Map the
Profilersamples and the trace'sLayoutevents (layouts caused by a forced reflow, explained below, carry the caller's stack) back to source files and lines, then add them up
await cdp.send("Emulation.setCPUThrottlingRate", { rate: 4 });
await cdp.send("Network.emulateNetworkConditions", {
  offline: false,
  latency: 150,
  downloadThroughput: (1.6 * 1024 * 1024) / 8,
  uploadThroughput: (750 * 1024) / 8,
});
await cdp.send("Profiler.start");Locally we also saw one long task of about 3.0 seconds right after load. Mapped back to the source, more than half of it came from a single component.
The slow part: an animation added per week to a year of cells
The time went to the practice log section near the bottom of the landing page. It has a one-year practice calendar that fills in from left to right as you scroll.
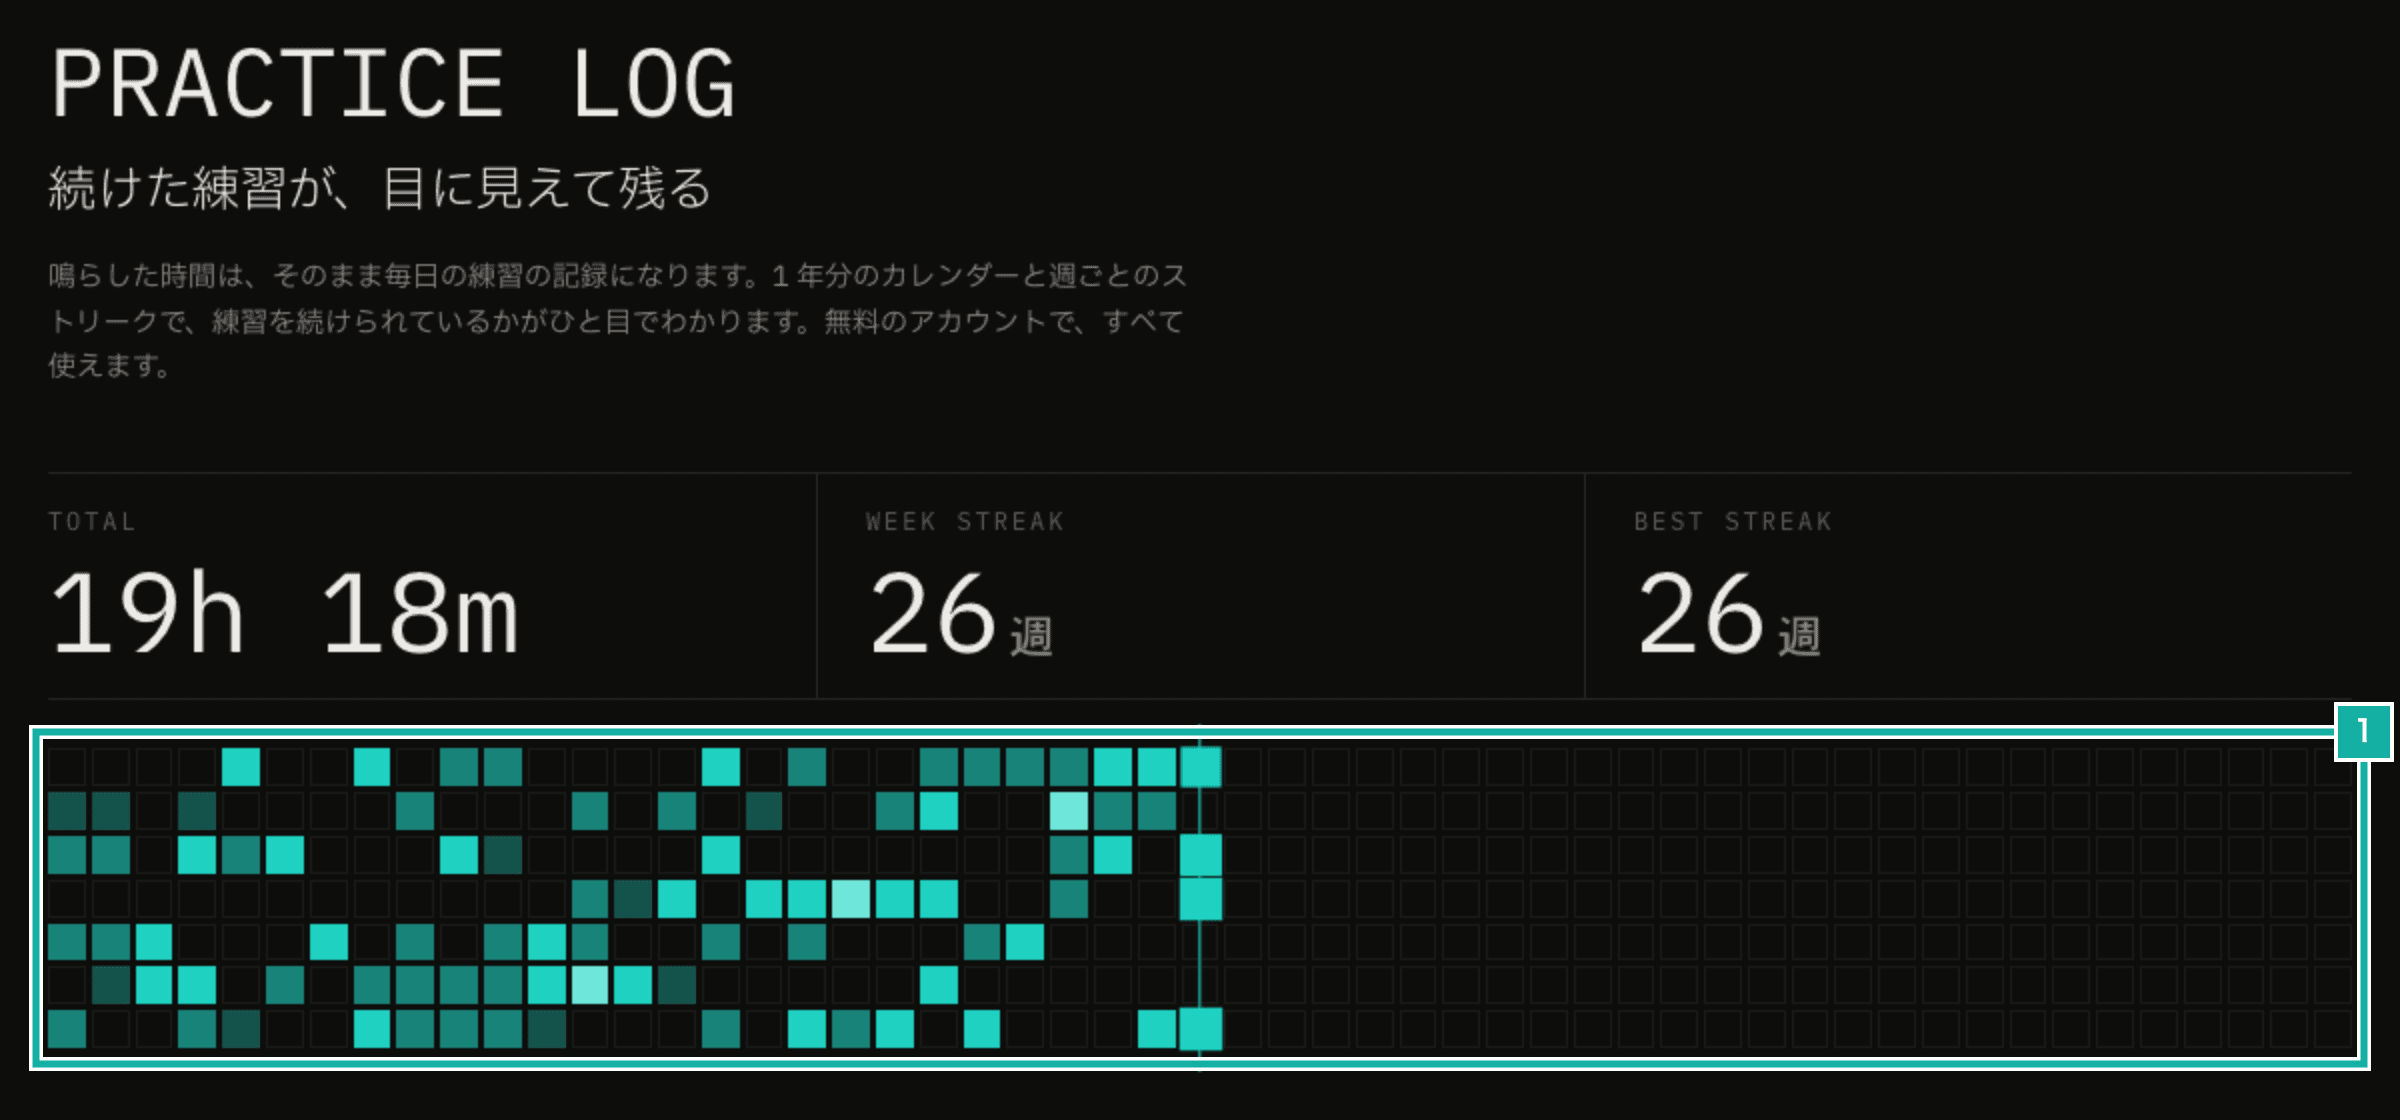
- There are several hundred cells, and each week had its own fill animation
The animation used fromTo per week to scale the cells from 0 to 1.
columns.forEach((column, index) => {
  timeline.fromTo(
    column.querySelectorAll("[data-fill]"),
    { scale: 0 },
    { scale: 1, duration: 0.6, stagger: 0.05, ease: "back.out(2)" },
    index,
  );
});The profile showed about 1.7 seconds in this section alone. The function that used the most time was inside GSAP's CSSPlugin, where it calls getComputedStyle.
The first time GSAP (3.15.0) animates an element's transform, it reads the current value with getComputedStyle. To fold the individual transform properties (translate, rotate, scale) into the transform, it also writes none to the element's style.scale and so on. Because fromTo writes the start value right away, reads and writes alternate once per cell. When you read after a write, the browser recalculates style and layout before returning the value (a forced reflow). The landing page has about 2,500 elements, and that recalculation was repeated hundreds of times.
Setting up offscreen animations when the browser is idle
This section is far down the page and isn't visible right after load. So we create only the calendar's vertical line and the pinning (the setting that holds the section on screen while you scroll and reserves that much scroll length) right away, and add the cell fill animations four weeks at a time when the browser is idle.
export const runInIdleBatches = <T>(
  items: readonly T[],
  batchSize: number,
  run: (batch: readonly T[]) => void,
): (() => void) => {
  const state = { next: 0, cancel: () => {}, cancelled: false };
  const step = () => {
    if (state.cancelled) return;
    run(items.slice(state.next, state.next + batchSize));
    state.next += batchSize;
    if (state.next < items.length) state.cancel = scheduleIdle(step);
  };
  if (items.length > 0) state.cancel = scheduleIdle(step);
  return () => {
    state.cancelled = true;
    state.cancel();
  };
};scheduleIdle uses requestIdleCallback, falling back to setTimeout where it isn't available. Each fill animation sits at the same point on the timeline (the week index) as before, and the timeline length doesn't change, so scrolling maps to the animation exactly as it did.
We found three more places with the same pattern.
- The horizontal feature strip: it read
offsetLeftfor each panel and then wrote withgsap.from. We now measure all positions first and create the reveal animations one panel at a time when idle - The line drawing in the hero (the large first block of the page): it called
getBoundingClientRectevery frame to check whether the hero was offscreen. We now get whether it's offscreen from anIntersectionObserverand keep that state - The app walkthrough video (about 1.5 MB): it fetched the whole file right after mount. We now fetch it after the page has loaded and the browser is idle, and show the poster image until then
At this point the longest task went from 3.0 seconds to about 1.3 seconds. What's left is setup for animations visible on the first screen, such as the opening (the first animation that plays right after load, covered in the next section) and the hero's character splitting. Deferring those would change how they look, so we left them.
To check that the animations look the same, we captured the landing page at 25 scroll positions at desktop and phone widths, before and after, and compared them pixel by pixel. The only differences were in the hero, where the metronome is playing and the beat had moved on between captures.
LCP was the hidden header
Lowering TBT barely moved LCP (when the largest element is painted). The element counted as LCP turned out to be the "Open the app" button at the right end of the header.
The first screen of the landing page is an opening where lines cross the screen and assemble the logo. The header was hidden during the opening and shown once the logo was assembled. The logo is drawn with lines and rectangles, so it isn't an LCP candidate (LCP candidates are elements with images or text). The largest candidate on the first screen was the header's "Open the app" button, and since it appeared only at the end of the opening, LCP was delayed until then too.
Showing "Open the app" earlier makes LCP earlier too. Since LCP is also used in search ranking, the "Open the app" button is no longer hidden during the opening and appears from the start. The buttons to its left (accent color, theme, and language) still appear after the opening, as before, because on phones they overlap the opening lines. We also removed the header's background so the opening lines aren't cut off behind it.
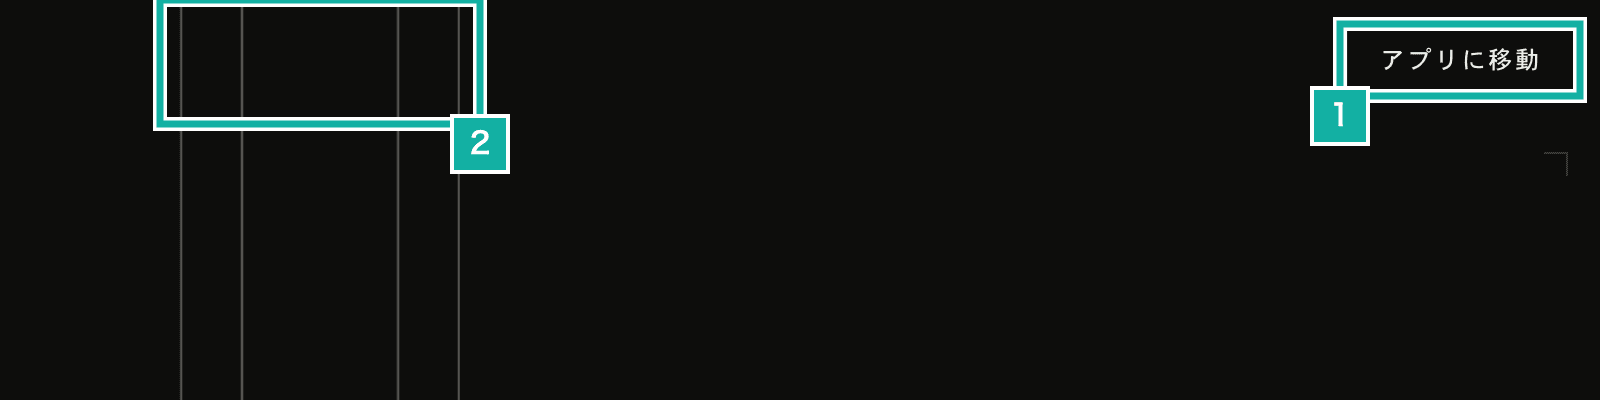
- The "Open the app" button that was counted as LCP, now visible right after load
- The header's background is gone, so the lines reach the top edge of the screen
In our local measurements, LCP went from 12.7 seconds to 4.3 seconds, the same time as the first paint (FCP).
Not loading Clerk on the landing page
Next we looked at the JavaScript the landing page loads. The script for Clerk, which we use for sign-in (about 84 KB), was loaded on the landing page too, even though the landing page has no sign-in. That was because ClerkProvider sat in the root layout and loaded on every page.
We grouped ClerkProvider, the site-wide header, and the sign-in dialogs into one component (AppChrome) and placed it only in the app, documentation, and blog layouts.
export const AppChrome = ({ children }: AppChromeProps) => (
  <AuthProvider>
    <Header />
    <div className="flex flex-1 flex-col">{children}</div>
    <AuthDialogs />
  </AuthProvider>
);We hit one snag here. We wanted the 404 page (app/not-found.tsx) to show the header too, so we wrapped it in AppChrome as well. That put Clerk's library code back into the landing page. The root not-found.tsx is loaded together with the root layout on every page, so the Clerk code it imported ended up in the landing page bundle as well. Compared with a version that doesn't wrap the 404 page in AppChrome, the landing page's JavaScript went from 2,023 KB to 1,673 KB uncompressed. That difference was big enough that we decided not to show the site-wide header on the 404 page. The 404 page itself still links to the home page and the docs.
On the server side, clerkMiddleware in proxy.ts was also running for the landing page. When Clerk re-validates a session it can redirect the page to Clerk (a handshake), which can add a round trip before the landing page is served. We now skip Clerk only for GET requests to the landing page.
export const proxy = (request: NextRequest, event: NextFetchEvent) =>
  request.method === "GET" && isLpPath(request.nextUrl.pathname)
    ? withoutClerk(request)
: withClerk(request, event);We kept POST requests going through Clerk because Server Actions can reach the landing page path. If you go back to the landing page with the browser's back button while the app is still playing, the Server Action that checks your plan's playback time limit is sent to the path of the page now open, the landing page. It calls Clerk's auth(), which fails if the middleware didn't run.
Shrinking the Japanese font to the landing page's characters
Last was the font. Scrolling through the whole landing page loaded 63 font files (about 570 KB), most of them IBM Plex Sans JP.
Japanese fonts loaded with next/font/google are split into many small files by character range (unicode-range). Only the files containing characters that appear on the page are loaded, but the landing page uses three weights (300, 400, 500), and each weight has its own set of files, which added up to 61 files. Rendering isn't blocked (font-display: swap), but on slow connections the fonts compete with JavaScript for bandwidth.
So we made one font per weight containing only the characters the landing page uses. If you pass characters to the Google Fonts API in text=, it returns a font with just those characters. It is built from the same Google font that next/font serves, so the glyphs don't change.
const cssUrl = `https://fonts.googleapis.com/css2?family=IBM+Plex+Sans+JP:wght@${weight}&text=${encodeURIComponent(chars)}`;
const css = await fetch(cssUrl, { headers: { "User-Agent": USER_AGENT } }).then((r) => r.text());
const fontUrl = css.match(/url\((https:\/\/fonts\.gstatic\.com\/[^)]+)\)\s*format\('woff2'\)/)?.[1];To collect the characters, a script scrolls through the landing page of a production build and gathers the characters drawn in IBM Plex Sans JP for each weight (on both /ja and /en). For each weight it writes an @font-face whose unicode-range lists the characters the new font contains, and that font goes first in the landing page's font stack.
const LP_FONT_STACK: CssVariables = {
  "--mfm-font-sans":
    '"IBM Plex Sans JP LP", var(--font-ibm-plex-sans-jp, "IBM Plex Sans JP"), "Hiragino Sans", sans-serif',
};If the copy changes and a character missing from the subset shows up, that character is drawn with the regular font that comes next, because the browser moves on to the next font for characters outside the unicode-range. Forgetting to regenerate the subset makes the page a little slower, not broken.
The new fonts are three files, about 110 KB in total. Fonts loaded across the whole landing page are now five files, about 130 KB, including IBM Plex Mono.
We didn't use next/font/local because options such as unicode-range apply to every file, so you can't give each weight a different range. Instead, the layout imports the CSS that the script writes. We also passed on using fewer weights and on font-display: optional (giving up on the font when it's slow), since both change how the page looks.
Results
These are production PageSpeed Insights (Lighthouse) results. We measured once or twice before and twice after. Lighthouse scores vary from run to run.
Page | Before | After |
|---|---|---|
/ja (mobile) | 31, 36 | 61, 69 |
/ja (desktop) | 45 | 67, 75 |
/en (mobile) | 40 | 61, 69 |
/en (desktop) | 54 | 69, 70 |
These are measurements of a local production build with the CPU slowed down 4x and the network limited to 1.6 Mbps (average of three runs; TBT is an estimate from the Long Tasks API).
Metric | Before | After |
|---|---|---|
FCP | about 4.6 s | about 2.9 s |
LCP | about 13.4 s | about 2.9 s |
TBT | about 3.4 s | about 1.4 s |
Longest task | about 3.0 s | about 1.0 s |
JavaScript (uncompressed) | 2,023 KB | 1,673 KB |
Fonts | 63 files, about 570 KB | 5 files, about 130 KB |
What remains is setup for the animations visible on the first screen, and ScrollTrigger (GSAP's scroll-driven animation plugin) re-measuring positions when the opening ends and the scrolling held during it is unlocked (about 0.4 seconds locally). Both would mean touching the animations, so we stopped here for now.
In a follow-up, we removed font definitions and zod that the whole site was loading, and cut down the ScrollTrigger re-measuring too. See the follow-up post.